What Are Absenteeism Metrics?
Absenteeism metrics are crucial HR performance indicators that measure employee absence rates and their impact on productivity. Key metrics include: • Absenteeism Rate • Bradford Factor • Lost Time Rate • Cost of Absenteeism These metrics help organizations identify trends, implement targeted interventions, and improve overall workforce management.
Absenteeism metrics are essential tools used by Human Resources departments to quantify, analyze, and manage employee absences. These metrics provide valuable insights into workforce productivity, employee well-being, and organizational health. By tracking and interpreting these metrics, companies can identify patterns, implement targeted interventions, and ultimately improve their bottom line.
Key Absenteeism Metrics
1. Absenteeism Rate
The absenteeism rate is the most fundamental metric, expressing the percentage of workdays lost due to absence over a specific period.
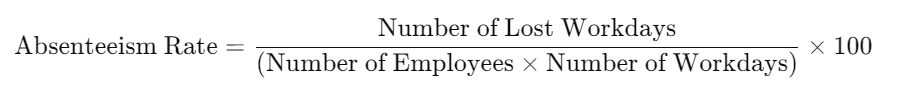
For example, if a company with 100 employees working 20 days a month loses 40 workdays due to absences, the absenteeism rate would be:

According to recent data from the U.S. Bureau of Labor Statistics, the average absenteeism rate across industries in the United States was approximately 3.2% in 2023.
2. Bradford Factor
The Bradford Factor is a more nuanced metric that considers the frequency and duration of absences. It’s based on the theory that short, frequent absences are more disruptive than longer, less frequent ones.
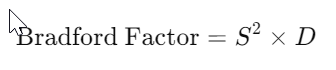
Where: S = Number of separate absence instances D = Total number of days absent
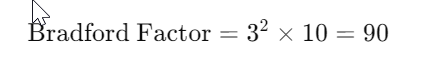
For instance, if an employee has 3 separate absences totaling 10 days over a year:
While there’s no universal Bradford Factor scale, here’s a common interpretation:
| Bradford Factor Score | Interpretation |
| 0-50 | Good |
| 51-124 | Concern |
| 125-399 | Unsatisfactory |
| 400+ | Serious concern |
3. Lost Time Rate
The Lost Time Rate (LTR) measures the percentage of total work time lost due to absences.
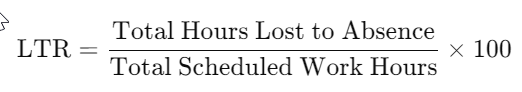
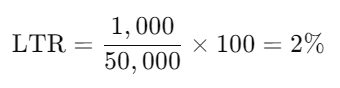
For example, if a company loses 1,000 hours to absence out of 50,000 scheduled work hours:
4. Cost of Absenteeism
This metric attempts to quantify the financial impact of absenteeism on an organization. It includes direct costs (like sick pay) and indirect costs (such as lost productivity, overtime for other employees, and administrative costs).

A 2023 study by the Society for Human Resource Management (SHRM) estimated that the average cost of absenteeism per employee in the U.S. was approximately $2,650 per year, or about £2,100 GBP.
Interpreting and Applying Absenteeism Metrics
While these metrics provide valuable data, their interpretation requires nuance and context. Here are some key considerations:
- Industry Benchmarks: Absenteeism rates vary significantly across industries. For example, healthcare typically has higher rates than finance or technology sectors.
- Seasonal Variations: Many industries experience seasonal fluctuations in absenteeism. Retail might see higher rates during holiday seasons, while education sees spikes during flu season.
- Company Size: Smaller companies may experience more significant impacts from individual absences.
- Work Culture: Companies with flexible work arrangements or generous leave policies may see different patterns in their metrics.
Remember: Absenteeism metrics are tools for understanding and improving workforce management, not for punitive measures. Always consider the human factor behind the numbers.
Advanced Absenteeism Analysis
To gain deeper insights, organizations often combine basic metrics with more sophisticated analyses:
1. Absence Frequency Distribution
This analysis looks at the distribution of absences across the workforce. It can help identify if absenteeism is a widespread issue or concentrated among a few employees.
| Number of Absences | Percentage of Workforce |
| 0-1 | 45% |
| 2-3 | 30% |
| 4-5 | 15% |
| 6+ | 10% |
2. Absence Reason Analysis
Categorizing absences by reason can reveal underlying issues:
| Reason | Percentage |
| Illness | 60% |
| Personal/Family Issues | 20% |
| Stress/Mental Health | 15% |
| Other | 5% |
3. Absence Duration Analysis
This looks at the length of absence instances:
| Duration | Percentage of Absences |
| 1 day | 40% |
| 2-3 days | 35% |
| 4-7 days | 20% |
| 8+ days | 5% |
Implementing Absenteeism Metrics: Best Practices
To effectively use absenteeism metrics, consider the following best practices:
- Regular Monitoring: Track metrics consistently, ideally on a monthly or quarterly basis.
- Contextual Analysis: Always interpret metrics within the broader context of your organization and industry.
- Employee Privacy: Ensure that individual health information is protected in compliance with regulations like HIPAA in the U.S. or GDPR in Europe.
- Transparent Communication: Share aggregated data with employees to foster understanding and engagement.
- Action-Oriented Approach: Use insights from metrics to implement targeted interventions, such as wellness programs or flexible work arrangements.
Challenges in Measuring Absenteeism
While absenteeism metrics are valuable, they come with challenges:
- Presenteeism: Metrics don’t capture the impact of employees who come to work ill or disengaged.
- Remote Work: The rise of remote work has blurred the lines between presence and absence, making traditional metrics less relevant.
- Data Accuracy: Ensuring consistent and accurate reporting across departments can be challenging.
- Cultural Differences: In global organizations, cultural attitudes towards absence can vary significantly.
❇️
The Future of Absenteeism Metrics
As workplace dynamics evolve, so too must our approach to absenteeism metrics. Here are some emerging trends:
- AI and Predictive Analytics: Advanced algorithms are being used to predict absence patterns and suggest proactive interventions.
- Holistic Wellbeing Metrics: Companies are increasingly looking at absenteeism as part of a broader employee wellbeing framework.
- Real-time Tracking: With cloud-based HR systems, many organizations are moving towards real-time absence tracking and analysis.
- Integration with Productivity Data: Some companies are exploring ways to correlate absence data with productivity metrics for a more nuanced understanding of impact.
According to a 2024 report by Deloitte, 73% of HR leaders plan to invest in advanced analytics for workforce management, including absenteeism metrics, over the next two years.
Conclusion
Absenteeism metrics are powerful tools for understanding and managing workforce dynamics. However, they’re most effective when used as part of a comprehensive, employee-centric approach to HR management. As we move further into the 2020s, organizations that can effectively leverage these metrics while adapting to changing work paradigms will be best positioned to build resilient, productive, and engaged workforces.
Key Takeaway: Absenteeism metrics are evolving. While traditional measures like absenteeism rate and Bradford Factor remain relevant, forward-thinking organizations are integrating these with broader wellbeing and productivity metrics for a more holistic view of workforce health.
Remember, the goal isn’t just to reduce absences, but to create a work environment where employees are healthy, engaged, and present – both physically and mentally. By thoughtfully applying absenteeism metrics, organizations can make significant strides towards this goal.
– The Monitask Team